
The 5 Questions Every Talent Review Should Answer to Support Company Growth 
A good talent review goes beyond ratings and grids, it should help your business answer…
LeighJuly 1, 2025

Researched-backed talent review solutions frameworks and analytics for data-driven, forward-thinking talent investment decisions.
Solution features:
Effortlessly integrate and customize a digital talent review workflow into your organization’s people operating system.

Experience a transformative solution that empowers your organization’s skills and roles to effortlessly align and thrive amidst the ever-changing demands of the industry. Our comprehensive approach ensures seamless adjustment and adaptation, enabling your workforce to stay agile and responsive to emerging trends and technologies.
Embrace the future with confidence, knowing that your organization is equipped with the necessary skills and capabilities to lead in a rapidly evolving business landscape.
Eliminate the risks and burdens associated with managing succession data across multiple sources and outdated tools. Experience the transformative power of our comprehensive digital solution, designed to simplify and streamline your succession management processes.
With our turnkey solution, you gain access to a range of powerful features and capabilities that empower you to effortlessly track, analyze, and optimize your succession data, ensuring seamless continuity and fostering a culture of effective talent management. Say hello to a future-proof and hassle-free succession management experience.

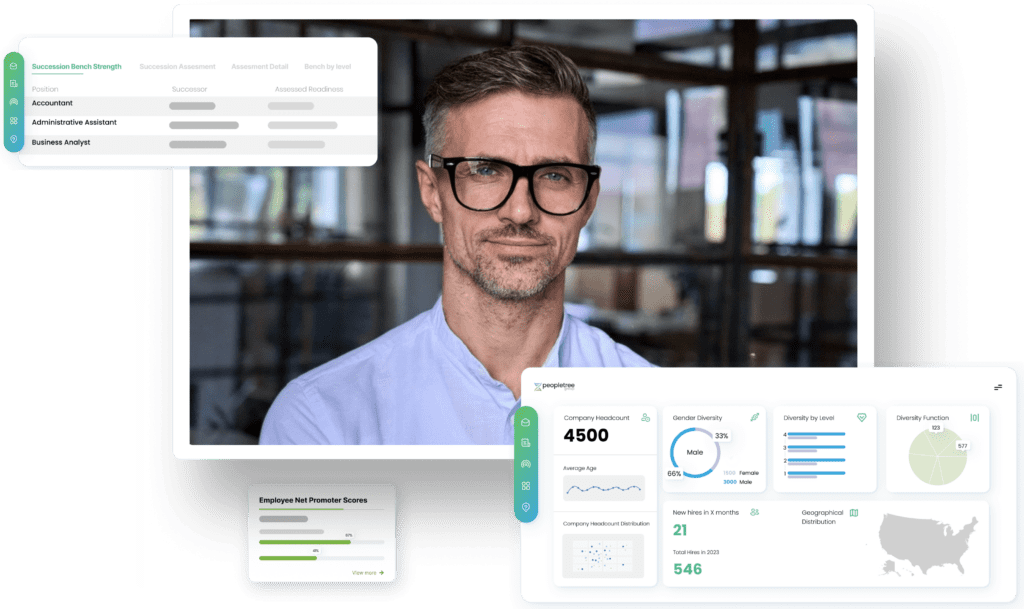
By combining advanced software, an integrated data management solution, pre-built analytics, and professional analytics services, we empower you to harness the power of data to drive strategic decision-making and optimize your organization’s most valuable asset—your people.
Peopletree’s Analytics Platform is the ultimate solution for modern HR teams.

Empower your organization to cultivate agile leaders who can effectively nurture a dynamic and adaptable workforce. With our comprehensive solution, we provide you the tools and framework to establish a clear leadership culture and model that aligns with your strategic direction.
By equipping your leaders with the essential skills, mindset, and capabilities, our solution enables them to successfully navigate the rapidly changing business landscape

Empower your people with enriching mentoring connections that drive connectivity and development. With the Peopletree mentoring platform, initiating, overseeing, and evaluating your mentoring program becomes effortless.
Recognizing the uniqueness of each mentoring initiative, our program offers inherent flexibility, allowing you to design a tailored program that ensures impactful participant enrollment.

Our digital platform allows you to effortlessly deploy pulse surveys, enabling you to connect with your employees on a regular basis. Our solution enables your team with valuable insights into employee satisfaction, team communication, and more.
By fostering open and honest communication, you can bridge the gap between management and staff, creating a cohesive and engaged workforce.